California Sterile License Study
2024 Market Analysis of Licensed Sterile Compounders
Turning a fragmented licensing portal into a searchable, enriched directory and market analysis of California sterile compounding capacity.
Overview
In 2024, I built an interactive research application that scraped the California Board of Pharmacy license verification portal to collect every active sterile compounding license, enriched each record using publicly available information, and delivered both (1) a searchable directory for safer sourcing and (2) an analytical report on California's sterile compounding market structure.
The outcome is a decision-ready dataset and application that helps providers, procurement teams, and analysts answer a deceptively hard question: "Who is actually licensed to provide sterile compounded drugs in California, and what can they do?"
Context / Risk
Sterile compounding supports critical therapies such as injections, infusions, and ophthalmic preparations. When legitimate access is limited, patients and providers face pressure to take shortcuts: sourcing from unsafe channels, purchasing unapproved chemicals, or rationing expired supplies. These behaviors increase patient harm and create legal and regulatory risk.
California is a high-demand market with a large population, but sterile access is constrained. The public licensing data exists, yet it is not packaged in a way that supports real-world sourcing, oversight, or market understanding.
The Problem
Patients, providers, and sourcing teams must navigate a patchwork of state licensing portals to identify eligible sterile compounders. Even within a single state, the information is difficult to use operationally.
- Discovery is hard: the licensing portal is not designed for targeted sourcing (specialty, condition, service type).
- Capabilities are missing: licensure alone does not explain what the pharmacy actually compounds or who they serve.
- Market visibility is poor: it is difficult to quantify capacity constraints or geographic distribution.
- Procurement decisions suffer: teams waste time on irrelevant listings and still miss viable options.
Why Existing Approaches Failed
The licensing portal is optimized for one-off verification, not for sourcing workflows or market analysis. Users can look up a facility, but they cannot easily:
- Search across the market by service capability, specialty, or condition
- Separate patient-specific (503A) from bulk in-office (503B outsourcer) options
- Understand what kinds of facilities hold sterile privileges (hospitals vs traditional pharmacies)
- Analyze expiration risk and renewal cycles
- Map geographic access and distribution
Without data extraction and enrichment, the licensing data remains "public" but not truly usable.
System Design
I designed the application as a combined directory + analysis report. The pipeline begins with extraction of California sterile compounding licenses and then enriches each listing using public web information to identify capabilities and relevance.
Data Collection
- Scraped the California Board of Pharmacy license verification portal to collect sterile licenses
- Standardized core fields (license type, facility name, address, city/county/zip, expiration dates)
- Geocoded records (LAT/LONG) to enable mapping and access analysis
Enrichment Layer (Differentiator)
The licensing portal does not describe what facilities actually do. I enriched the dataset using publicly available information (websites, social profiles, and online presence) to classify and make the directory searchable by real-world capability.
- Facility type classification: medical facility, infusion center, sterile compounding pharmacy, veterinary-only, research center
- Service capability taxonomy: specialties, conditions served
- Affiliations: claimed accreditations, associations, industry signals
- Purchasing style signals: patient-specific vs bulk in-office sourcing; 503B outsourcer indicator where applicable
Product Experience
- Interactive filters for facility type, city, specialty, condition, and accreditations
- Searchable results table with export/download for operational use
- Analysis tab with narrative + visualizations (license types, facility distribution, geography, expirations)
Product Views
The following screenshots show how the application supports both sourcing workflows (directory/search) and strategic understanding (market analysis).
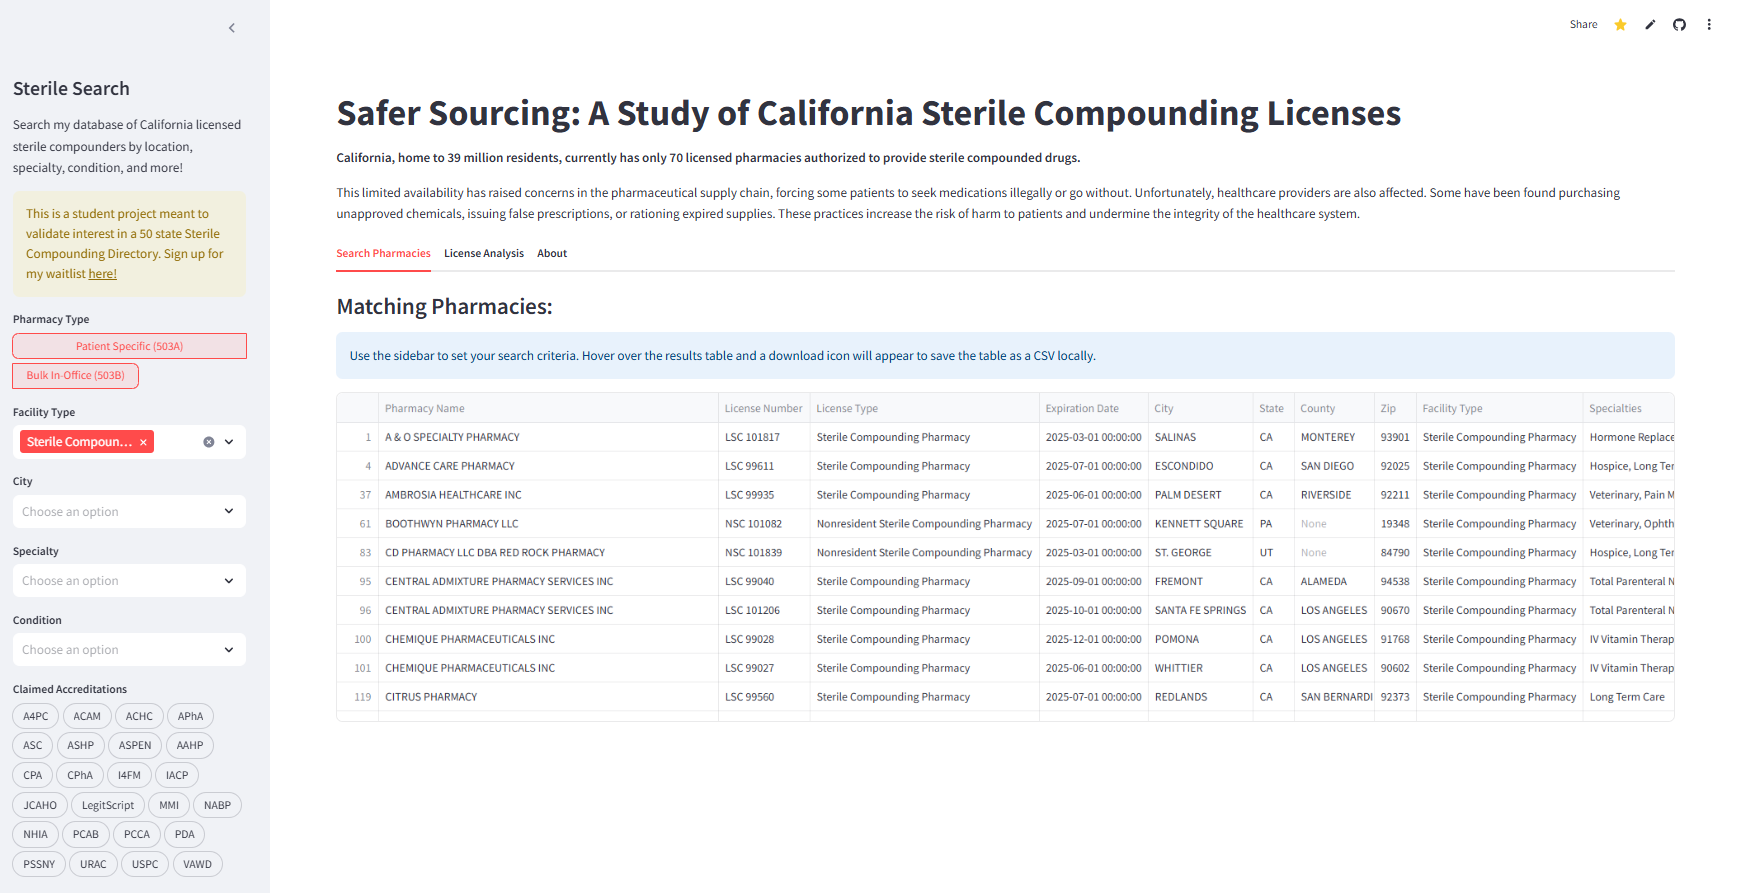
Sidebar-driven search across licensed sterile compounders by pharmacy type (patient-specific vs bulk in-office), facility type, city, specialty, condition, and accreditations. Results are shown in an interactive table with export/download for operational use.
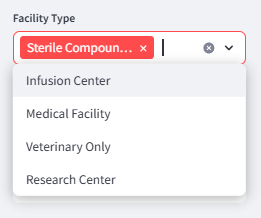
Facility type filter allowing users to narrow results to specific categories such as medical facilities, infusion centers, or sterile compounding pharmacies.
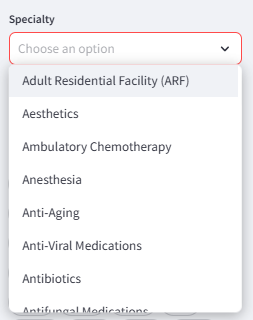
Specialty filter to search by clinical focus areas and service capabilities enriched from public information.
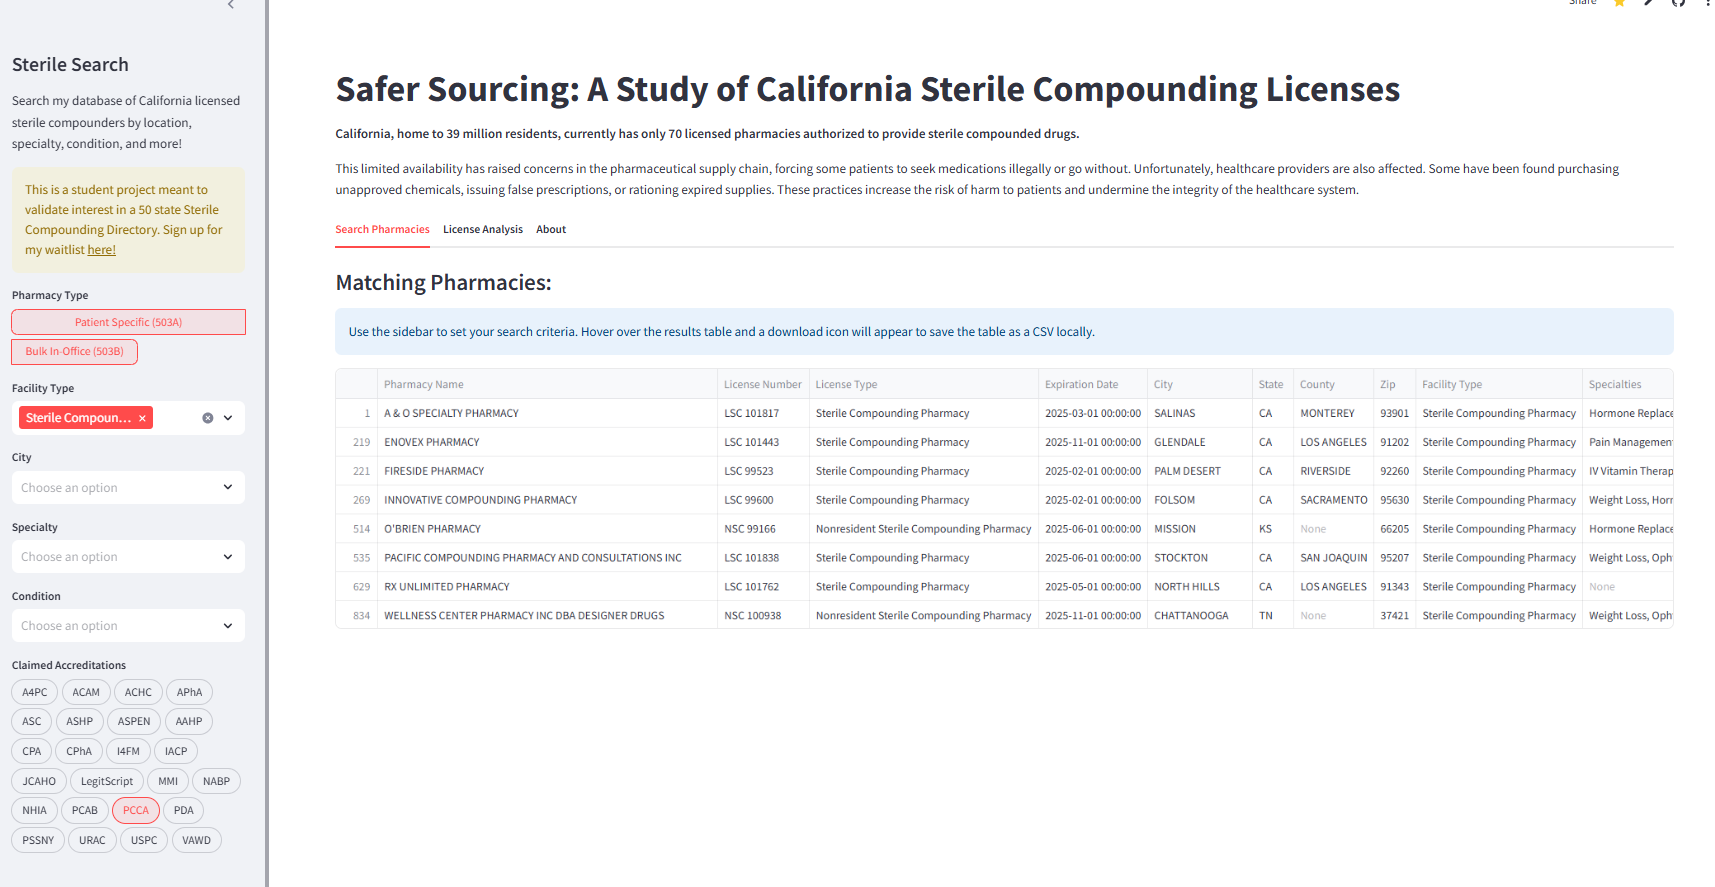
Accreditation filter combined with results table view, showing how filters narrow the directory to facilities with specific quality signals.
Analysis tab combining explanatory narrative with a table of contents for navigating market insights. Designed to be readable by non-technical leaders while still audit-friendly for analysts.
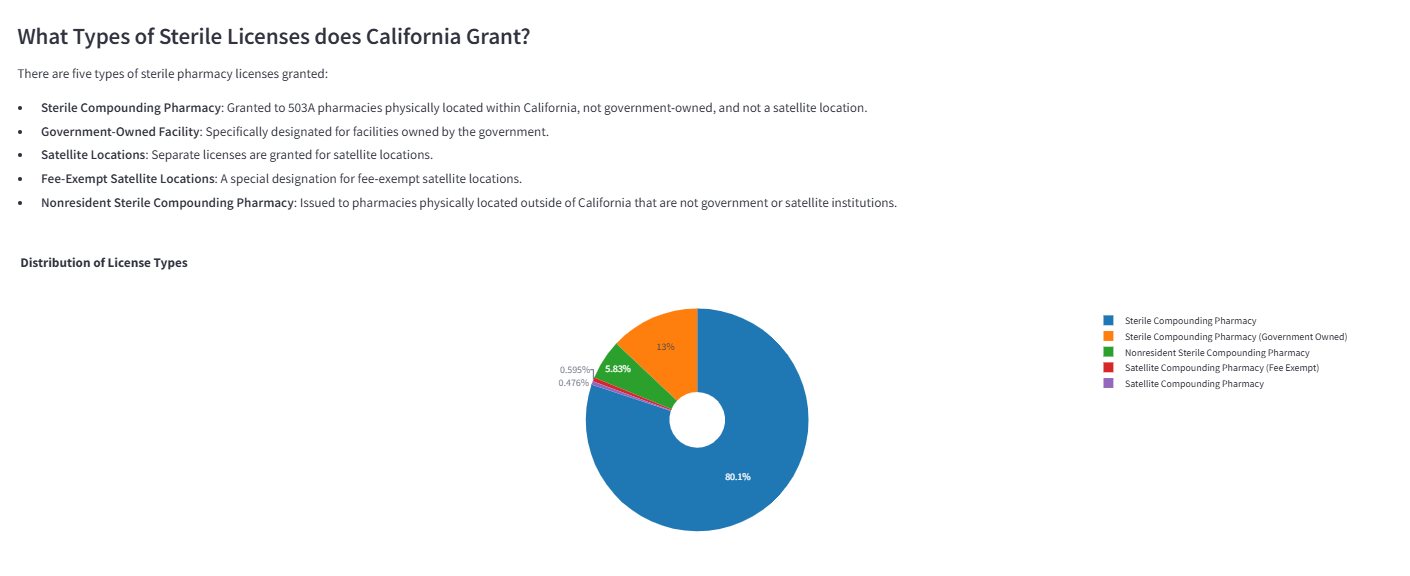
Distribution analysis of license types across California's sterile compounding market.
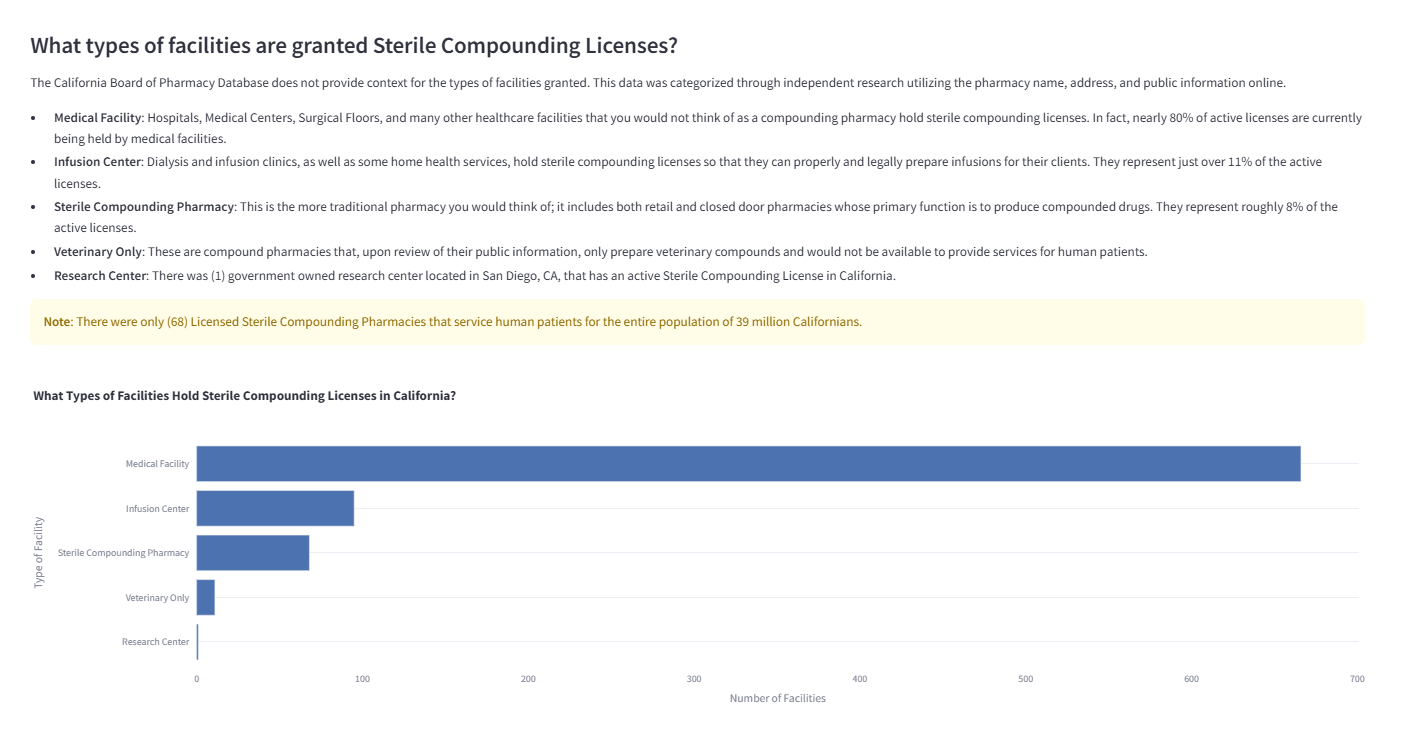
Breakdown of facility categories holding sterile compounding privileges, revealing the diversity beyond traditional pharmacies.
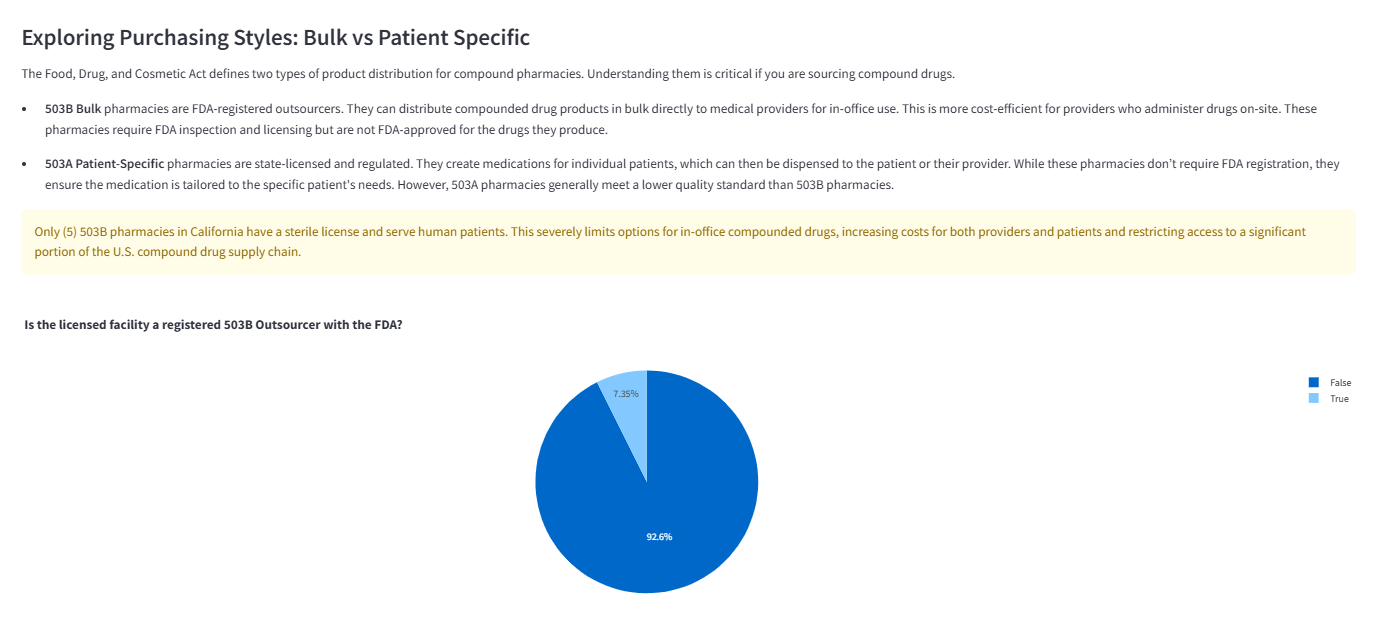
Comparison of patient-specific (503A) versus bulk in-office (503B) sourcing options across the licensed population.
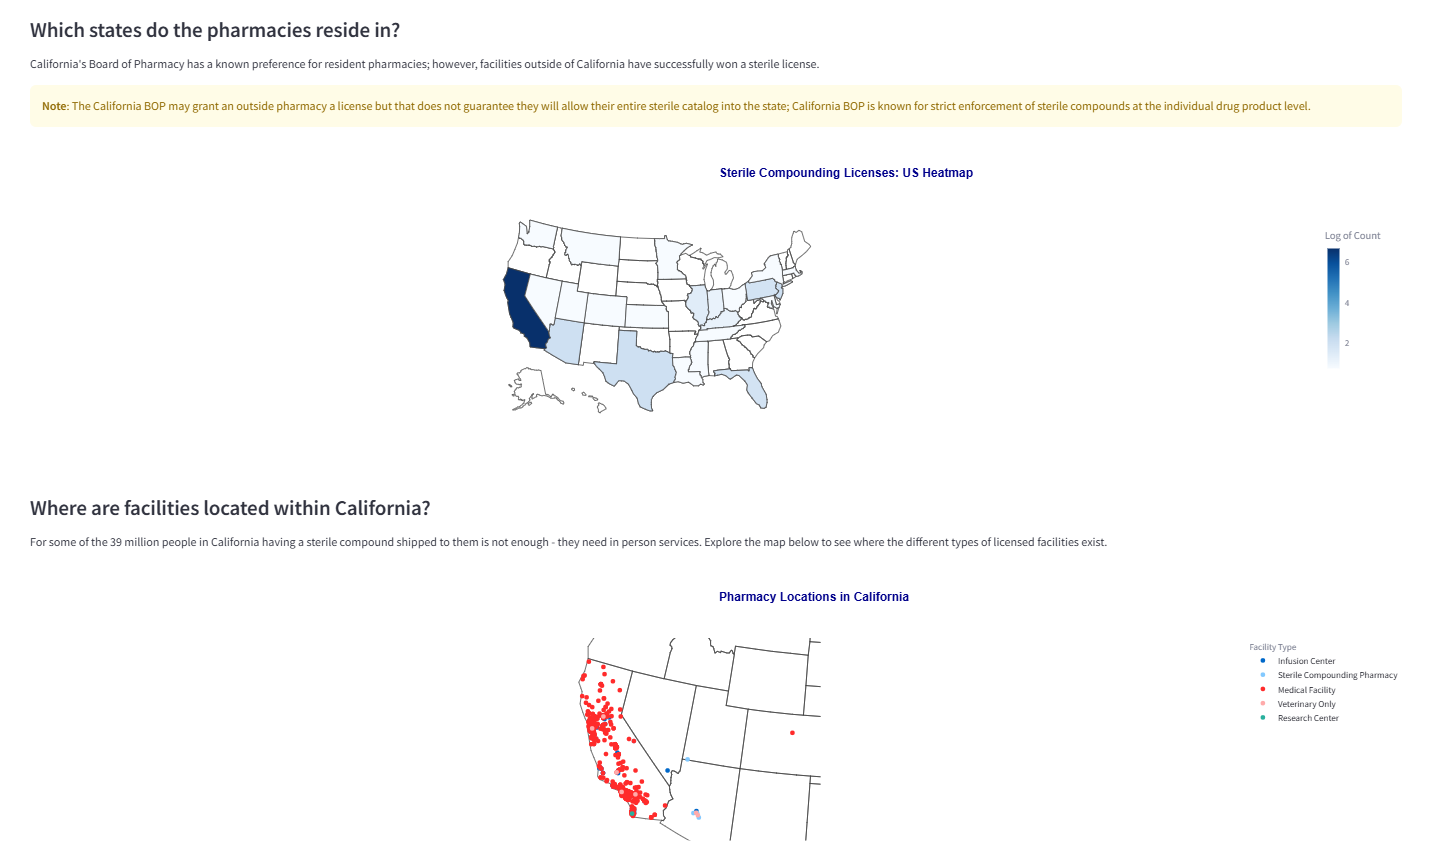
Visualizes where licensed facilities are located and maps access patterns. This supports practical sourcing decisions for services that require proximity, not shipping.
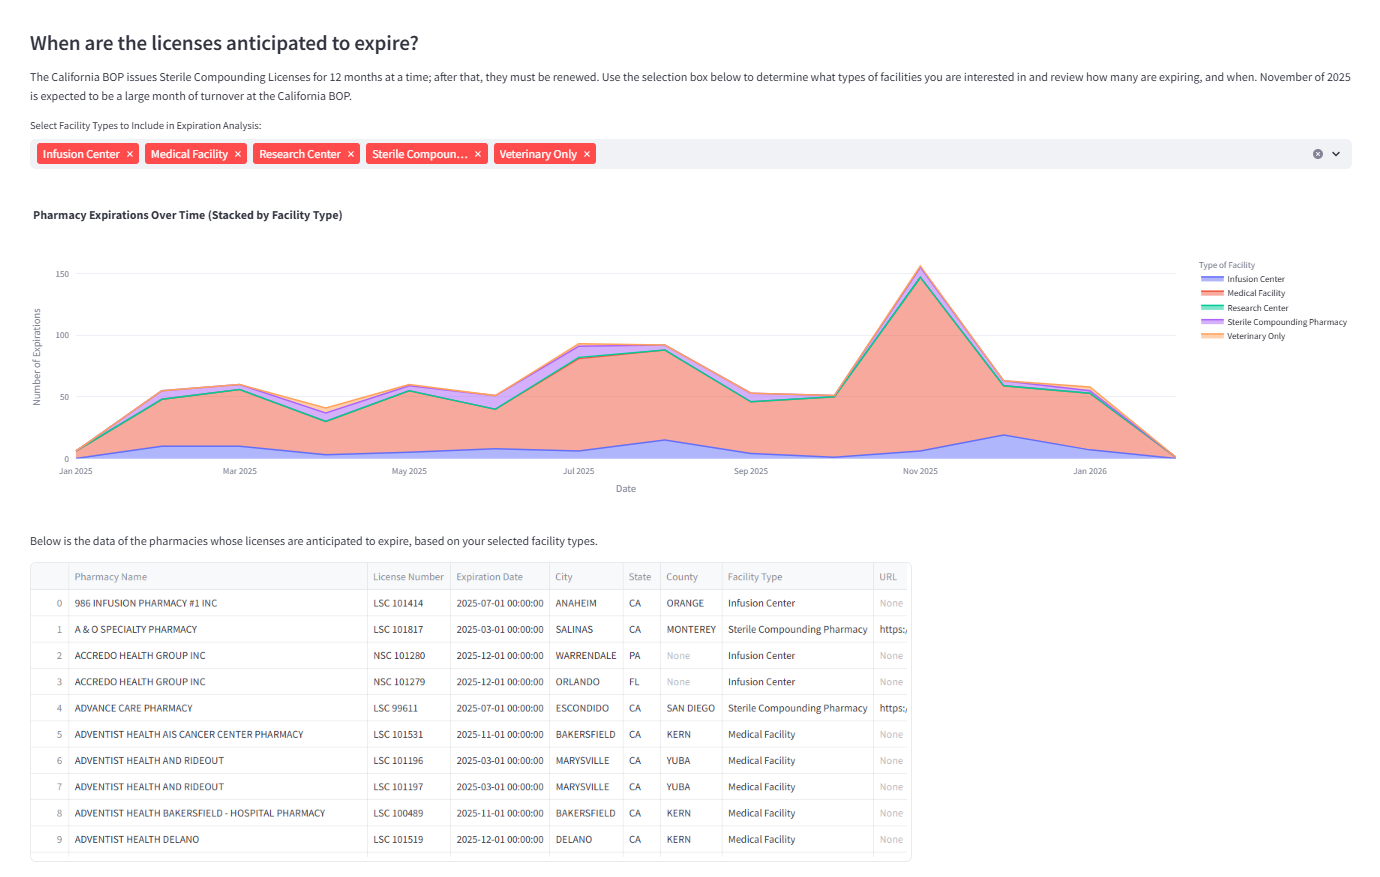
Expiration trend analysis to anticipate renewal cycles and potential turnover risk. Supports targeted outreach and monitoring.
Decisions Enabled
- Safer sourcing: quickly identify which facilities are actually licensed for sterile compounding and filter to relevant capabilities
- Bulk vs patient-specific purchasing clarity: differentiate sourcing paths and constraints for in-office administration vs patient prescriptions
- Market structure visibility: quantify what types of facilities hold sterile privileges (not just "pharmacies")
- Geographic access insight: identify coverage gaps and proximity constraints for in-person sterile services
- Renewal/turnover planning: anticipate license expirations and identify periods of high renewal volume
- Operational handoff: export a cleaned list for procurement workflows, outreach, or internal tracking
Who This Was For
This project was built for stakeholders who need to source sterile compounded medications safely and legally, including:
- Clinic operators and medical practices purchasing sterile compounds
- Procurement and supply chain teams supporting sterile sourcing
- Pharmacy operations leaders monitoring sterile compounding access
- Analysts evaluating market capacity, access, and licensing constraints
Why This Matters
Licensing data is technically public, but it is not packaged for real-world decision-making. This project shows how to convert a single-state licensing portal into a decision-ready directory with meaningful classification, searchable capability signals, and analysis that explains the market in plain language.
It also serves as a prototype for a broader vision: consolidating sterile compounding licensing across all 50 states into a unified directory that reduces friction, improves sourcing safety, and makes regulated markets legible.
Technical Notes
The application was implemented as an interactive Streamlit product with a pandas-based analytics layer and Plotly visualizations, backed by a cleaned and enriched CSV dataset. Key implementation details include:
- Reusable filtering logic across multiple dimensions (facility type, geography, specialty, condition, accreditations)
- Term cleaning and normalization for searchable multi-value fields (specialties, conditions, accreditations)
- Geospatial visualizations using LAT/LONG for map-based exploration
- Download/export workflows to support operational use cases